有4种不同类别的决策树算法:ID3、C4.5、C5.0和CART,其中sklearn实现了CART(Classification and Regression Trees)
Iris分类
使用决策树对iris数据分类。实现流程如下:
加载数据
创建决策树
预测结果
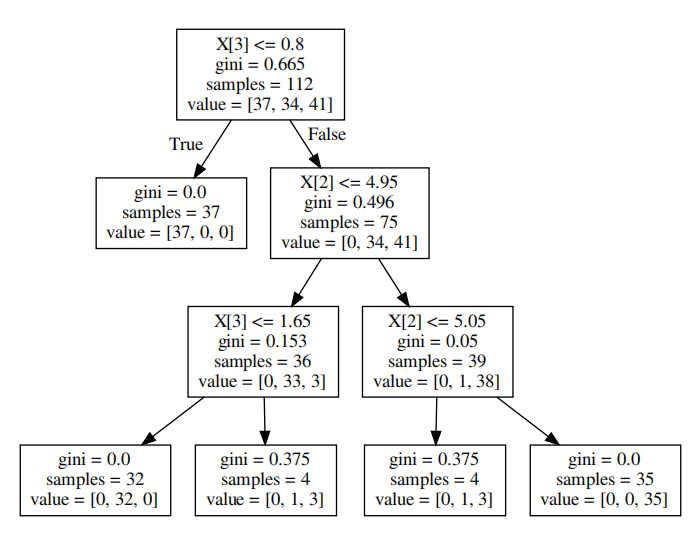
可视化决策树
计算最优
所需导入文件及函数如下
1
2
3
4
5
6
import numpy as np
import pandas as pd
import graphviz
from sklearn.model_selection import train_test_split
from sklearn.datasets import load_iris
from sklearn.tree import DecisionTreeClassifier, plot_tree, export_graphviz
加载数据
1
2
3
4
5
6
7
8
9
10
11
12
13
import pandas as pd from sklearn.model_selection import train_test_split from sklearn.datasets import load_iris
def get_best_depth(X_train, X_test, Y_train, Y_test, max_depth=6): # List of values to try for max_depth: max_depth_range = list(range(1, max_depth)) # List to store the average RMSE for each value of max_depth: accuracy = [] for depth in max_depth_range: clf = DecisionTreeClassifier(max_depth=depth, random_state=0) clf.fit(X_train, Y_train) score = clf.score(X_test, Y_test) accuracy.append(score) print(accuracy)
Requires little data preparation. Other techniques often require data normalisation, dummy variables need to be created and blank values to be removed. Note however that this module does not support missing values. scikit-learn uses an optimised version of the CART algorithm; however, scikit-learn implementation does not support categorical variables for now.