1
2
3
4
5
6
7
8
9
10
11
12
13
14
15
16
17
18
19
20
21
22
23
24
25
26
27
28
29
30
31
32
33
34
35
36
37
38
39
40
41
42
43
44
45
46
47
48
49
50
51
52
53
54
55
56
57
58
59
60
61
62
63
64
65
66
67
68
69
70
71
72
73
74
75
76
77
78
79
80
81
82
83
84
85
86
87
88
89
90
91
92
93
94
95
96
97
98
99
100
|
"""
@author: zj
@file: multi-pr-nn.py
@time: 2020-01-11
"""
import numpy as np
import matplotlib.pyplot as plt
from nn_classifier import NN
from sklearn.preprocessing import label_binarize
from sklearn import datasets
from sklearn.model_selection import train_test_split
from sklearn.metrics import precision_recall_curve
from sklearn.metrics import average_precision_score
def load_data():
iris = datasets.load_iris()
X = iris.data
y = iris.target
X_train, X_test, y_train, y_test = train_test_split(X, y, test_size=.5)
return X_train, X_test, y_train, y_test
if __name__ == '__main__':
X_train, X_test, y_train, y_test = load_data()
n_classes = 3
x_train = X_train.astype(np.float64)
x_test = X_test.astype(np.float64)
mu = np.mean(x_train, axis=0)
var = np.var(x_train, axis=0)
eps = 1e-8
x_train = (x_train - mu) / np.sqrt(np.maximum(var, eps))
x_test = (x_test - mu) / np.sqrt(np.maximum(var, eps))
classifier = NN(None, input_dim=4, num_classes=3)
classifier.train(x_train, y_train, num_iters=100, batch_size=8, verbose=True)
res_labels, y_score = classifier.predict(x_test)
precision = dict()
recall = dict()
average_precision = dict()
y_test = label_binarize(y_test, classes=[0, 1, 2])
for i in range(n_classes):
precision[i], recall[i], _ = precision_recall_curve(y_test[:, i], y_score[:, i])
average_precision[i] = average_precision_score(y_test[:, i], y_score[:, i])
precision["micro"], recall["micro"], _ = precision_recall_curve(y_test.ravel(), y_score.ravel())
average_precision["micro"] = average_precision_score(y_test, y_score, average="micro")
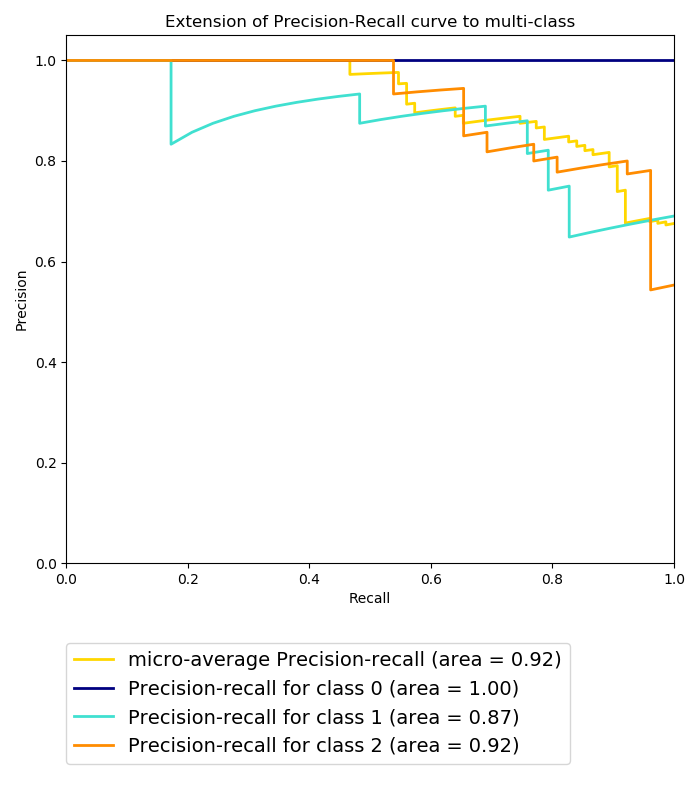
print('Average precision score, micro-averaged over all classes: {0:0.2f}'.format(average_precision["micro"]))
colors = ['navy', 'turquoise', 'darkorange', 'cornflowerblue', 'teal']
plt.figure(figsize=(7, 8))
f_scores = np.linspace(0.2, 0.8, num=4)
lines = []
labels = []
l, = plt.plot(recall["micro"], precision["micro"], color='gold', lw=2)
lines.append(l)
labels.append('micro-average Precision-recall (area = {0:0.2f})'.format(average_precision["micro"]))
for i, color in zip(range(n_classes), colors):
l, = plt.plot(recall[i], precision[i], color=color, lw=2)
lines.append(l)
labels.append('Precision-recall for class {0} (area = {1:0.2f})'
''.format(i, average_precision[i]))
fig = plt.gcf()
fig.subplots_adjust(bottom=0.15)
plt.xlim([0.0, 1.0])
plt.ylim([0.0, 1.05])
plt.xlabel('Recall')
plt.ylabel('Precision')
plt.title('Extension of Precision-Recall curve to multi-class')
plt.legend(lines, labels, loc=(0, -.38), prop=dict(size=14))
plt.show()
|